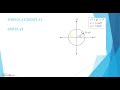
Plot a unit circle using sine and cosine functions in MATLAB
MATLAB Program:
syms t; t=0:0.001:2*pi; x=cos(t); y=sin(t); plot(x,y); axis square
syms t; t=0:0.001:2*pi; x=cos(t); y=sin(t); plot(x,y); axis square


This book combines the teaching of the MATLAB® programming language with the presentation and development of carefully selected electrical...


.jpg)


No comments